MTF stands for Modulation Transfer Function. It illustrates the optical quality of camera lens, a.k.a. “sharpness”. MTF chart is a curve of the transmittance of light (0 to 100%) against the distance from the centre of the image towards its edges (in millimetres).
Take an FX lens for example. The FX capture area (sensor) is 24mm x 36mm. Measuring diagonally from the centre to the corner, that is 21.63mm. Therefore the MTF chart for FX lens should have the x-axis from 0 to 21.63mm. Although measurement is usually at 0, 5, 10, 15, and 20mm locations, and vertical grid lines are drawn on those locations.
The measurement is a pattern of black lines over a white background. The lines that is parallel to the diagonal line of measurement on the sensor are called sagittal lines and those orthogonal to the diagonal line are called meridional lines. The lines (black-white-black-white of equal distances) can be in different spatial frequencies: Typically 10 lines/mm (low frequency to measure contrast) or 30 lines/mm (high frequency to measure resolution). Therefore, you will see curves on the MTF charts marked with S10, S30, M10, and M30. The higher and flatter the curves, the better.
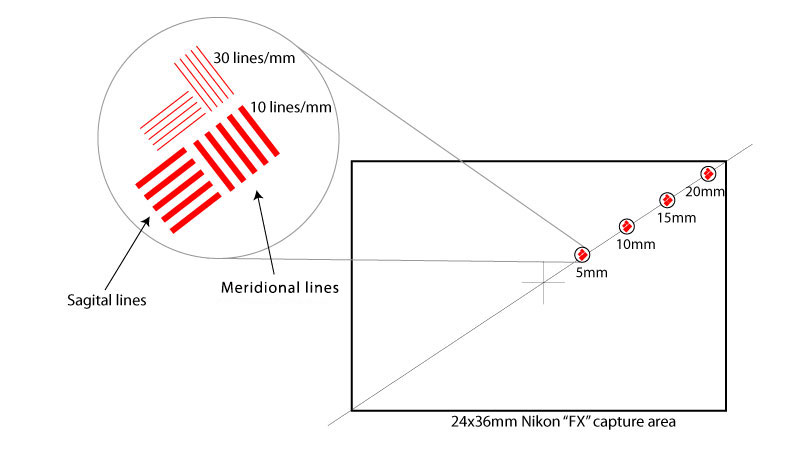
This is how MTF can tell about contrast and resolution: With the black-and-white lines pattern, a good lens will keep the lines clearly distinguishable but a bad one will blur them, producing dark grey-light gray pattern instead of black-and-white. At 30 lines/mm, a good lens keeps the clear boundary, allows a high optical resolution. At 10 lines/mm, even a bad lens is unlikely to blur the pattern to a flat grey. Therefore, you should expect the S10 and M10 curves are above S30 and M30 curves.
If the curves show obvious wavy pattern (i.e., going down as away from centre, up again, then down to the far end), the lens has field curvature (i.e., plane of focus is wavy-curved, not flat, not spherical).
If the sagittal and meridional lines are widely separated, the lens is badly corrected for astigmatism (blurry focus due to point light source stretched into lines or ovals) and lateral optical aberrations (focus differently between centre and the edge, leading to color fringing towards the edges of the frame).
Note that the MTF chart does not tell anything about distortion, color reproduction, vignetting, lens flare, or longitudinal aberrations (different color frequency focused differently).
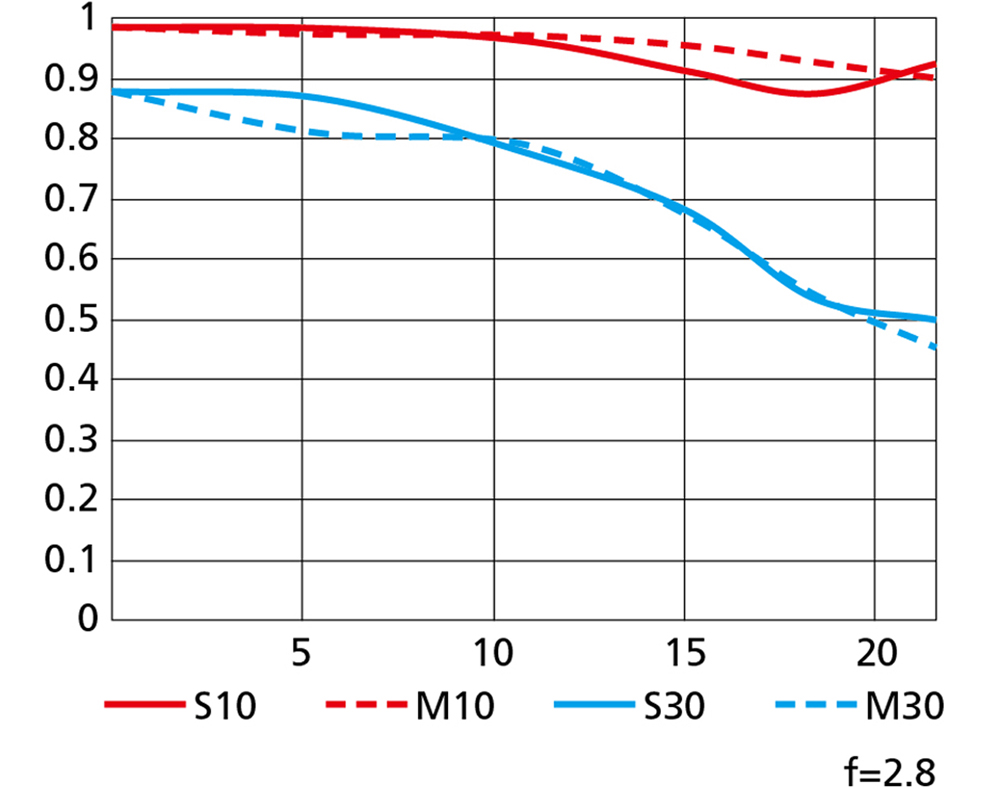
Below are the MTF charts of two Nikkor lens of identical zoom range: The AF-S 24-70 f/2.8E ED VR (F-mount) and the Z 24-70 f/2.8S (Z-mount). The MTF charts from Nikon are measured with maximum aperture:
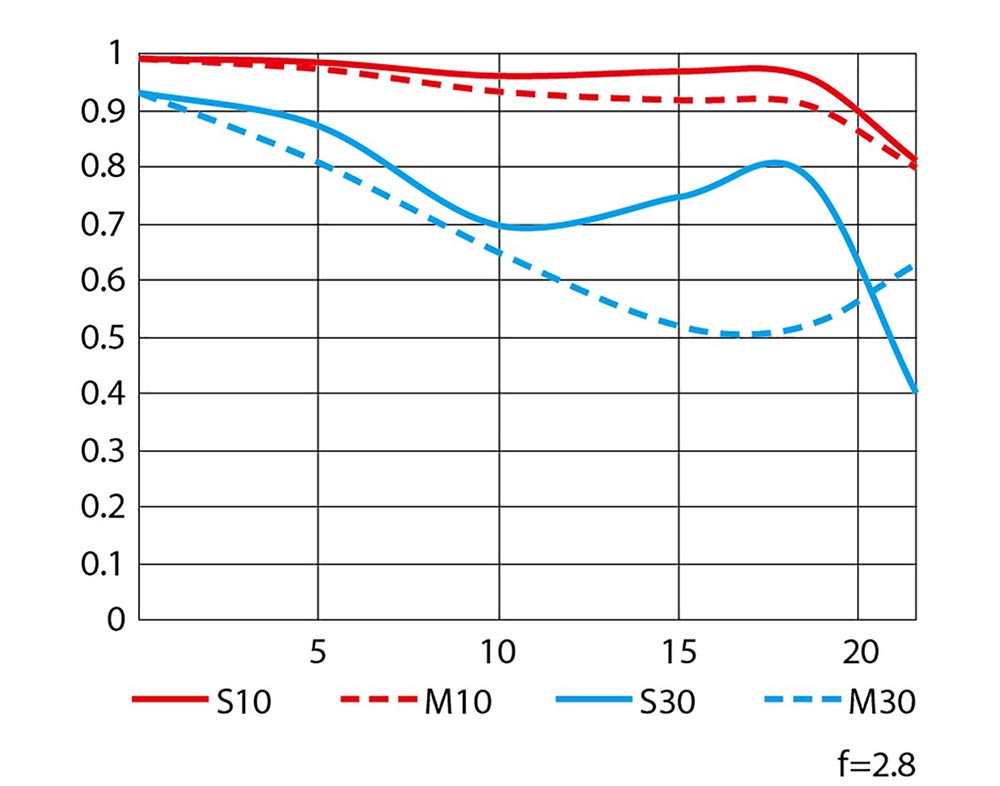
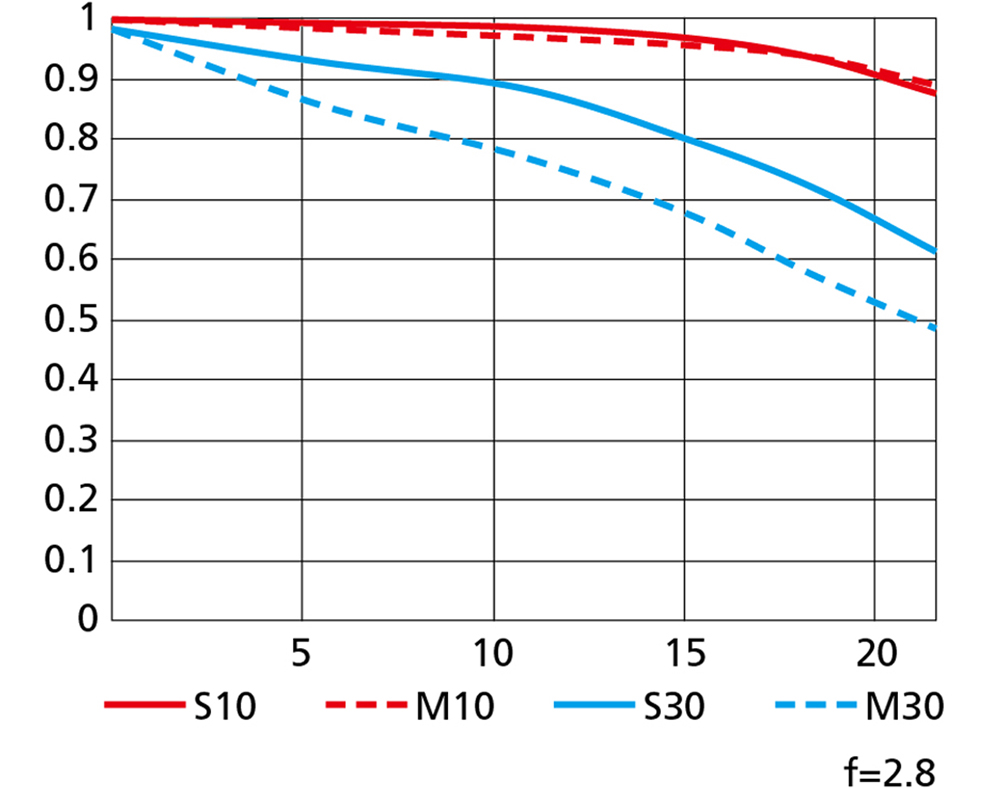
This shows the Z-mount lens is superior because all curves are above the F-mount counterpart. Also the F-mount one shows a “wavy” S30 curve, and wider separation between S and M counterparts, thus it is less sharp.
These are wide end MTF charts, i.e., at 24mm. Let’s see also the Z-mount tele end (70mm):
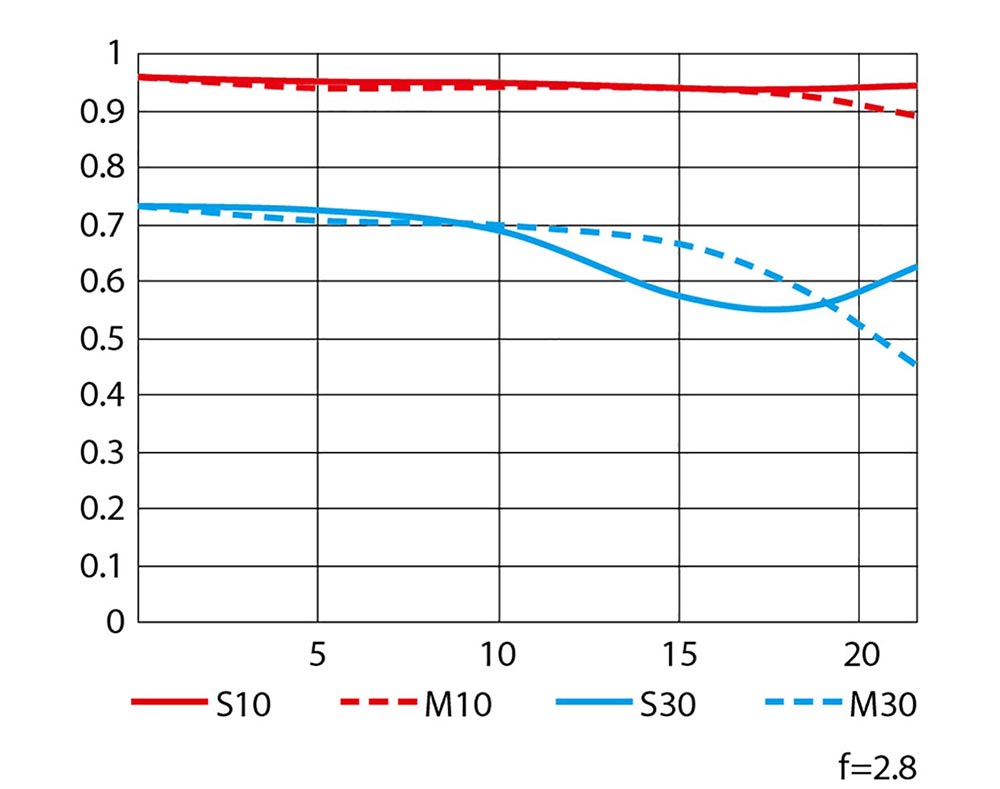
The S30 and M30 curves are lower than the wide counterparts. Thus it is less sharp on the tele-end. But S30 is closer to M30, thus the aberrations should be less pronounced, however.
References
- What is a Lens MTF Chart & How Do I Read It?, Nikon Learn & Explore
- Nikkor Z 24-70mm f/2.8 S
- Nikkor AF-S 24-70mm f/2.8E ED VR